Visualize your Wiz security issues
This guide demonstrates how to set up a monitoring solution to gain visibility into security issues from your Wiz account.
We will see how to visualize vulnerabilities across your projects and track them over time using Port's Wiz integration.
Common use cases
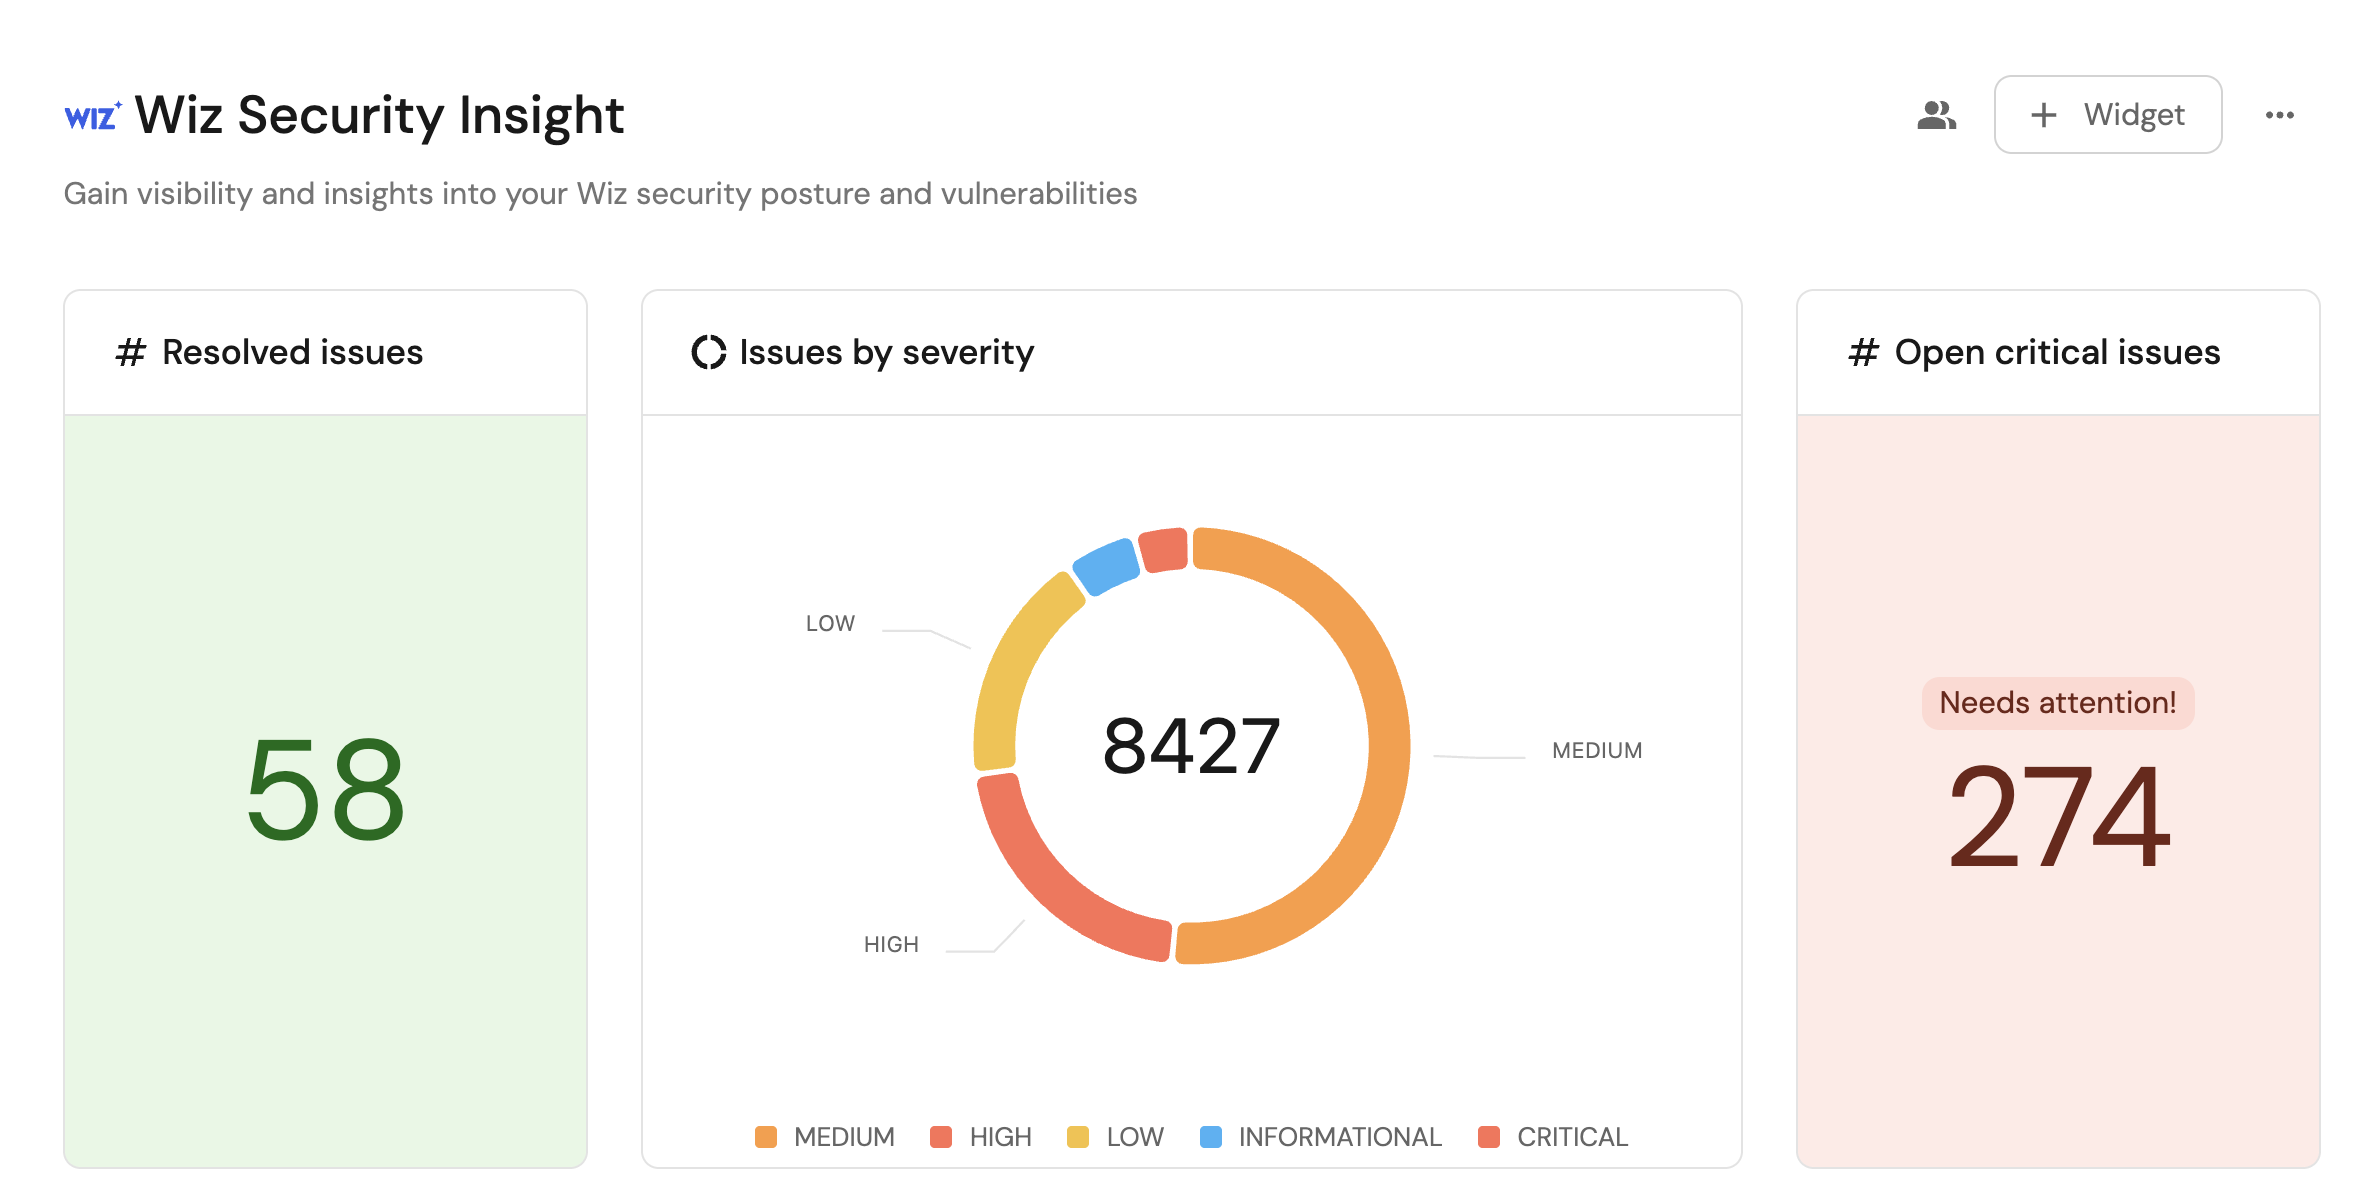
- Monitor open and resolved Wiz issues across projects.
- Understand the distribution of issues by severity and status.
Prerequisites
This guide assumes the following:
- You have a Port account and have completed the onboarding process.
- Port's Wiz integration is installed in your account.
Visualize metrics
Once the Wiz data is synced to the catalog, we can create a dedicated dashboard in Port to monitor and analyze vulnerabilities using customizable widgets.
Create a dashboard
- Navigate to your software catalog.
- Click on the
+ Newbutton in the left sidebar. - Select New dashboard.
- Name the dashboard Wiz Security Insight.
- Select the
Wizicon. - Click
Create.
We now have a blank dashboard where we can start adding widgets to visualize insights from the Wiz issues.
Add widgets
In the new dashboard, create the following widgets:
Issue by severity (click to expand)
-
Click
+ Widgetand select Pie chart. -
Title:
Issue by severity. -
Choose the Wiz Issue blueprint.
-
Under
Breakdown by property, select the Severity property
-
Click Save.
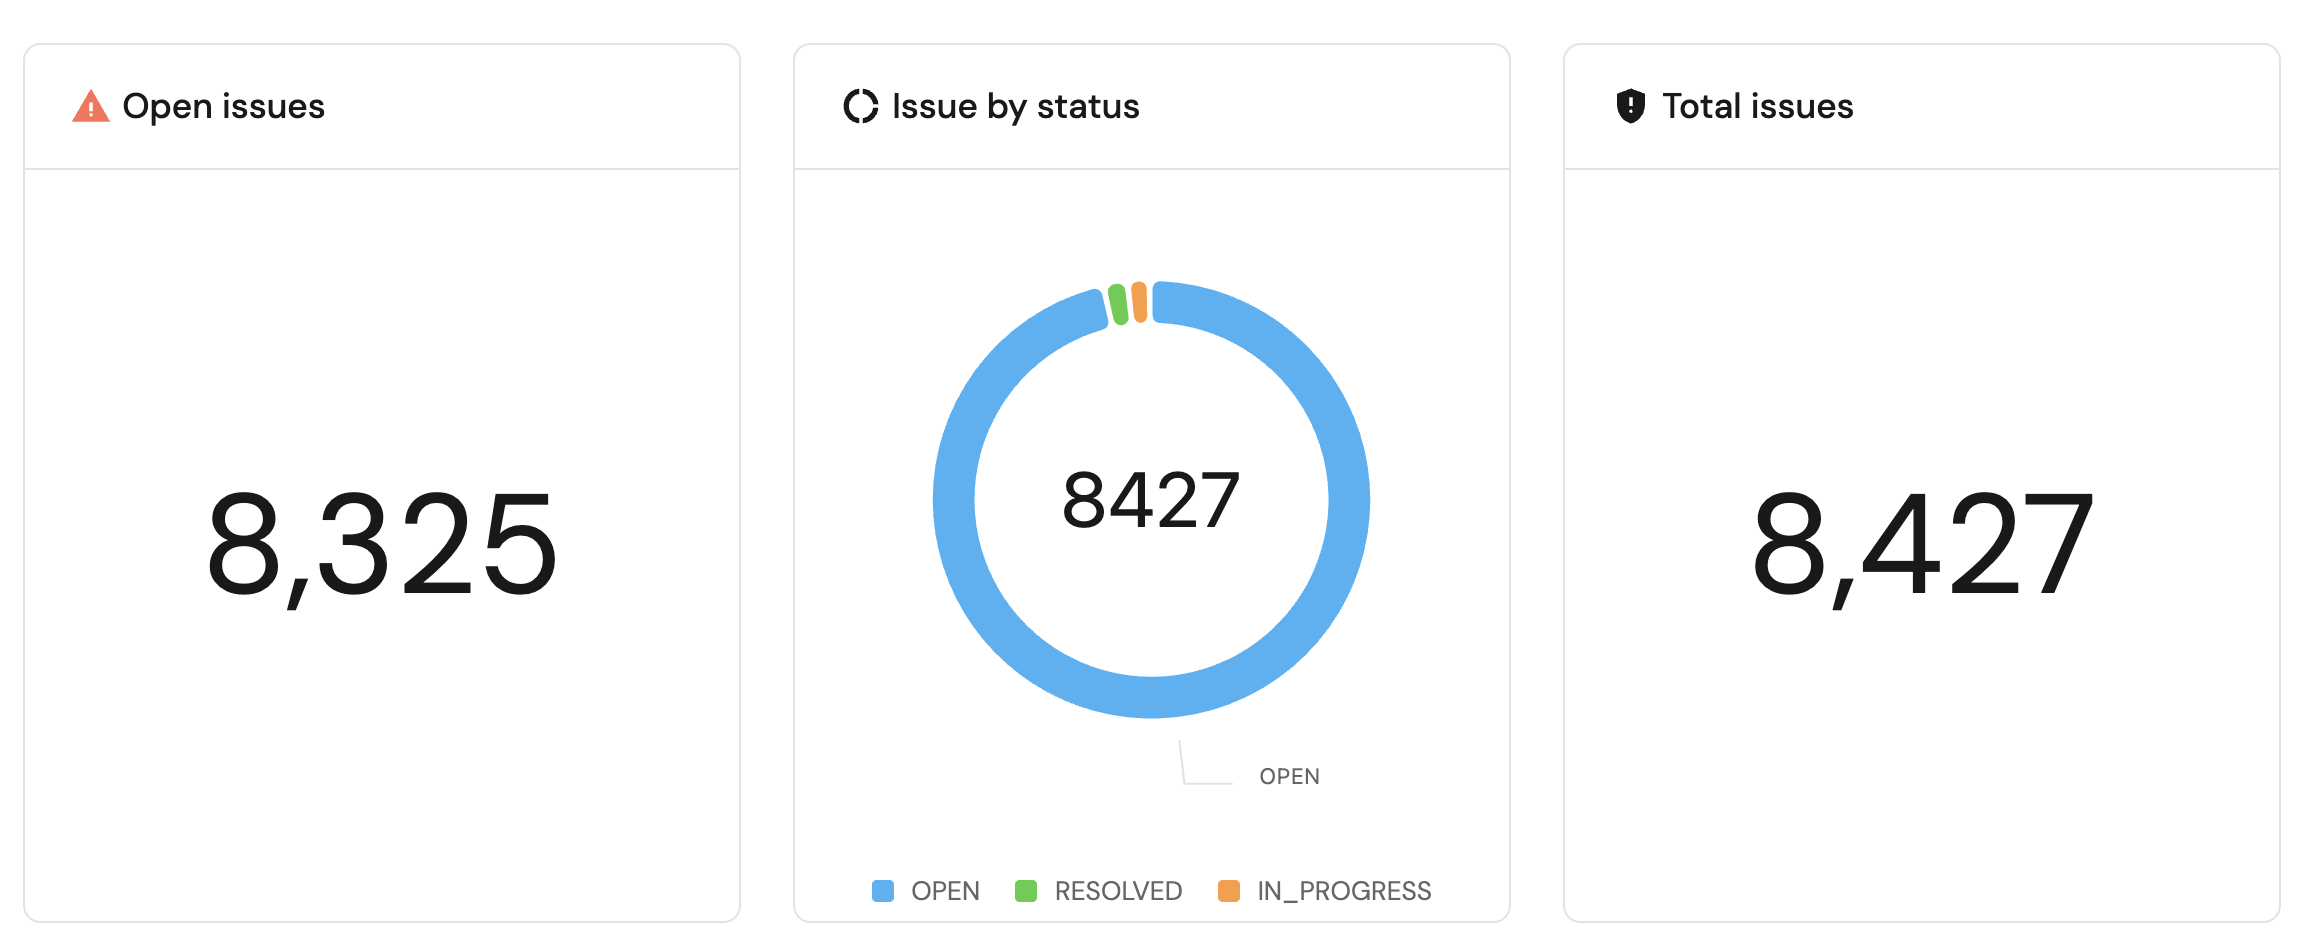
Issue by status (click to expand)
-
Click
+ Widgetand select Pie chart. -
Title:
Issue by status. -
Choose the Wiz Issue blueprint.
-
Under
Breakdown by property, select the Status property
-
Click Save.
Total number of issues (click to expand)
-
Click
+ Widgetand select Number Chart. -
Title:
Total issues. -
Select
Count entitiesChart type and choose Wiz Issue as the Blueprint. -
Select
countfor the Function. -
Select
customas the Unit and inputissuesas the Custom unit.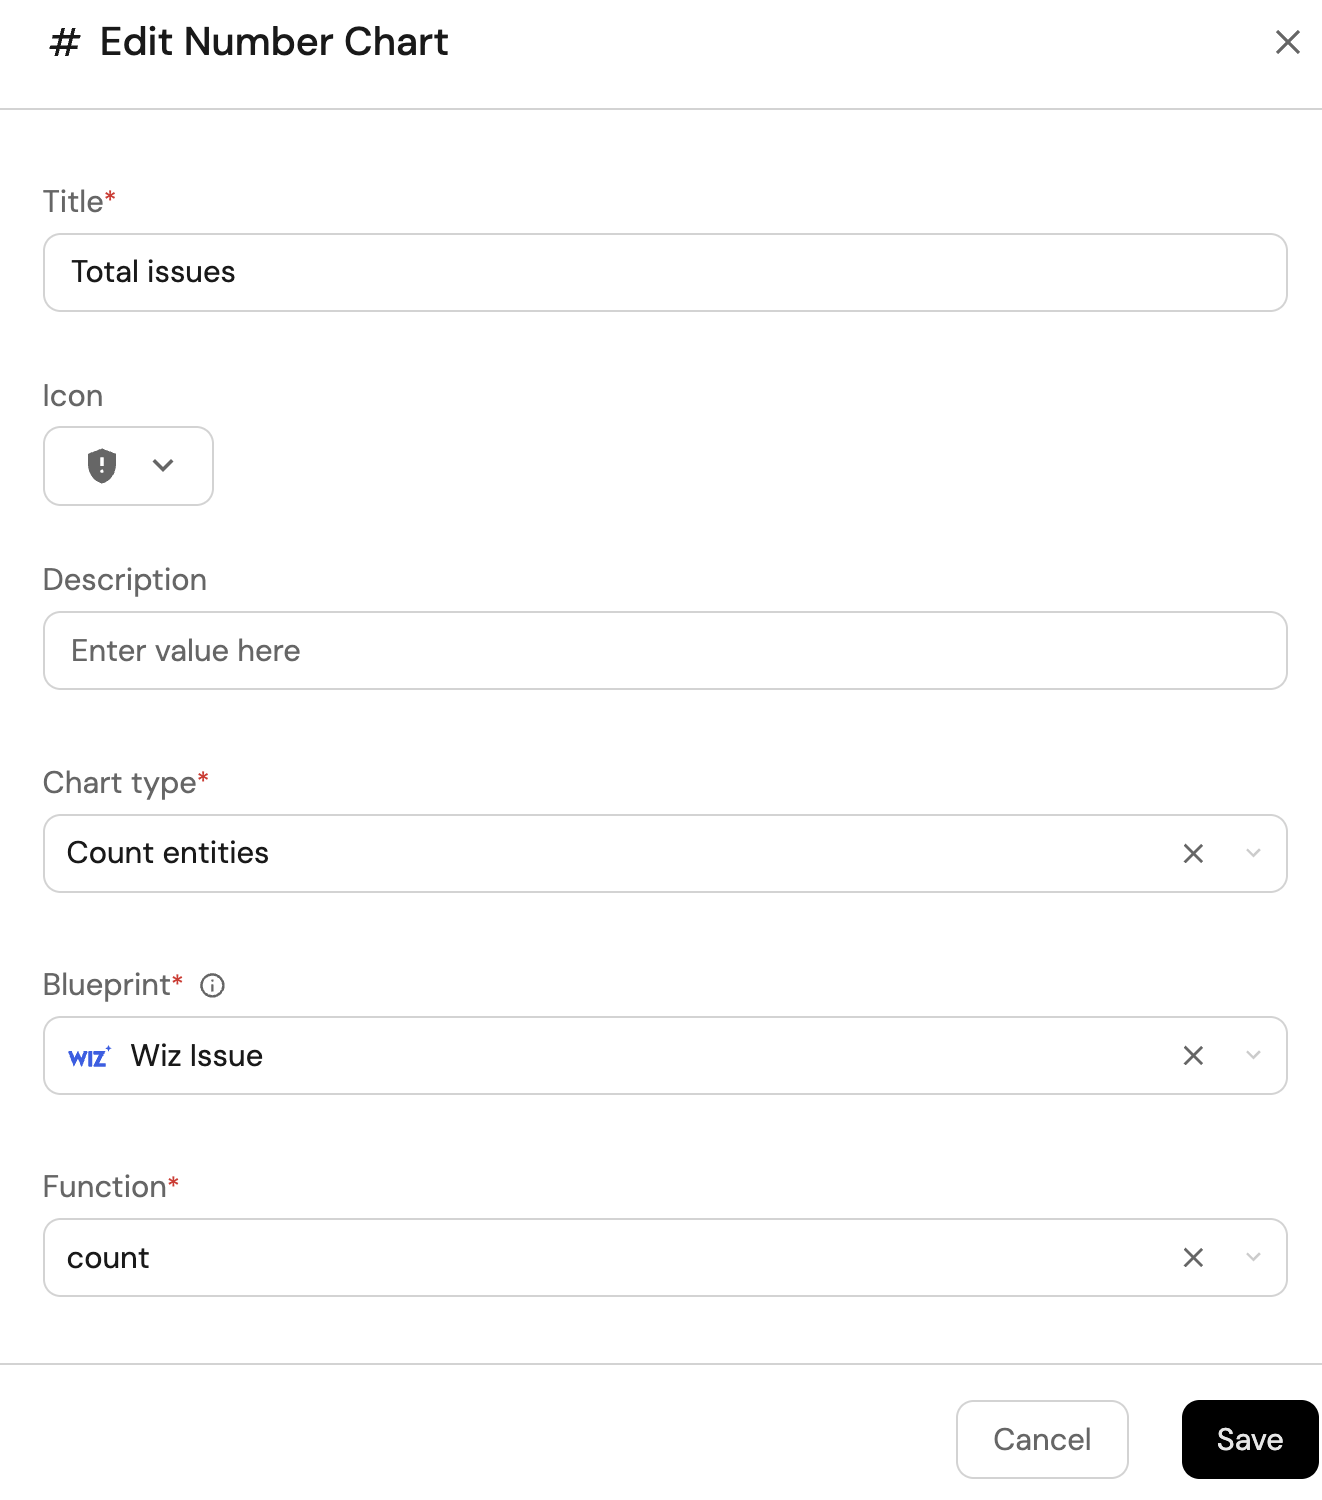
-
Click
Save.
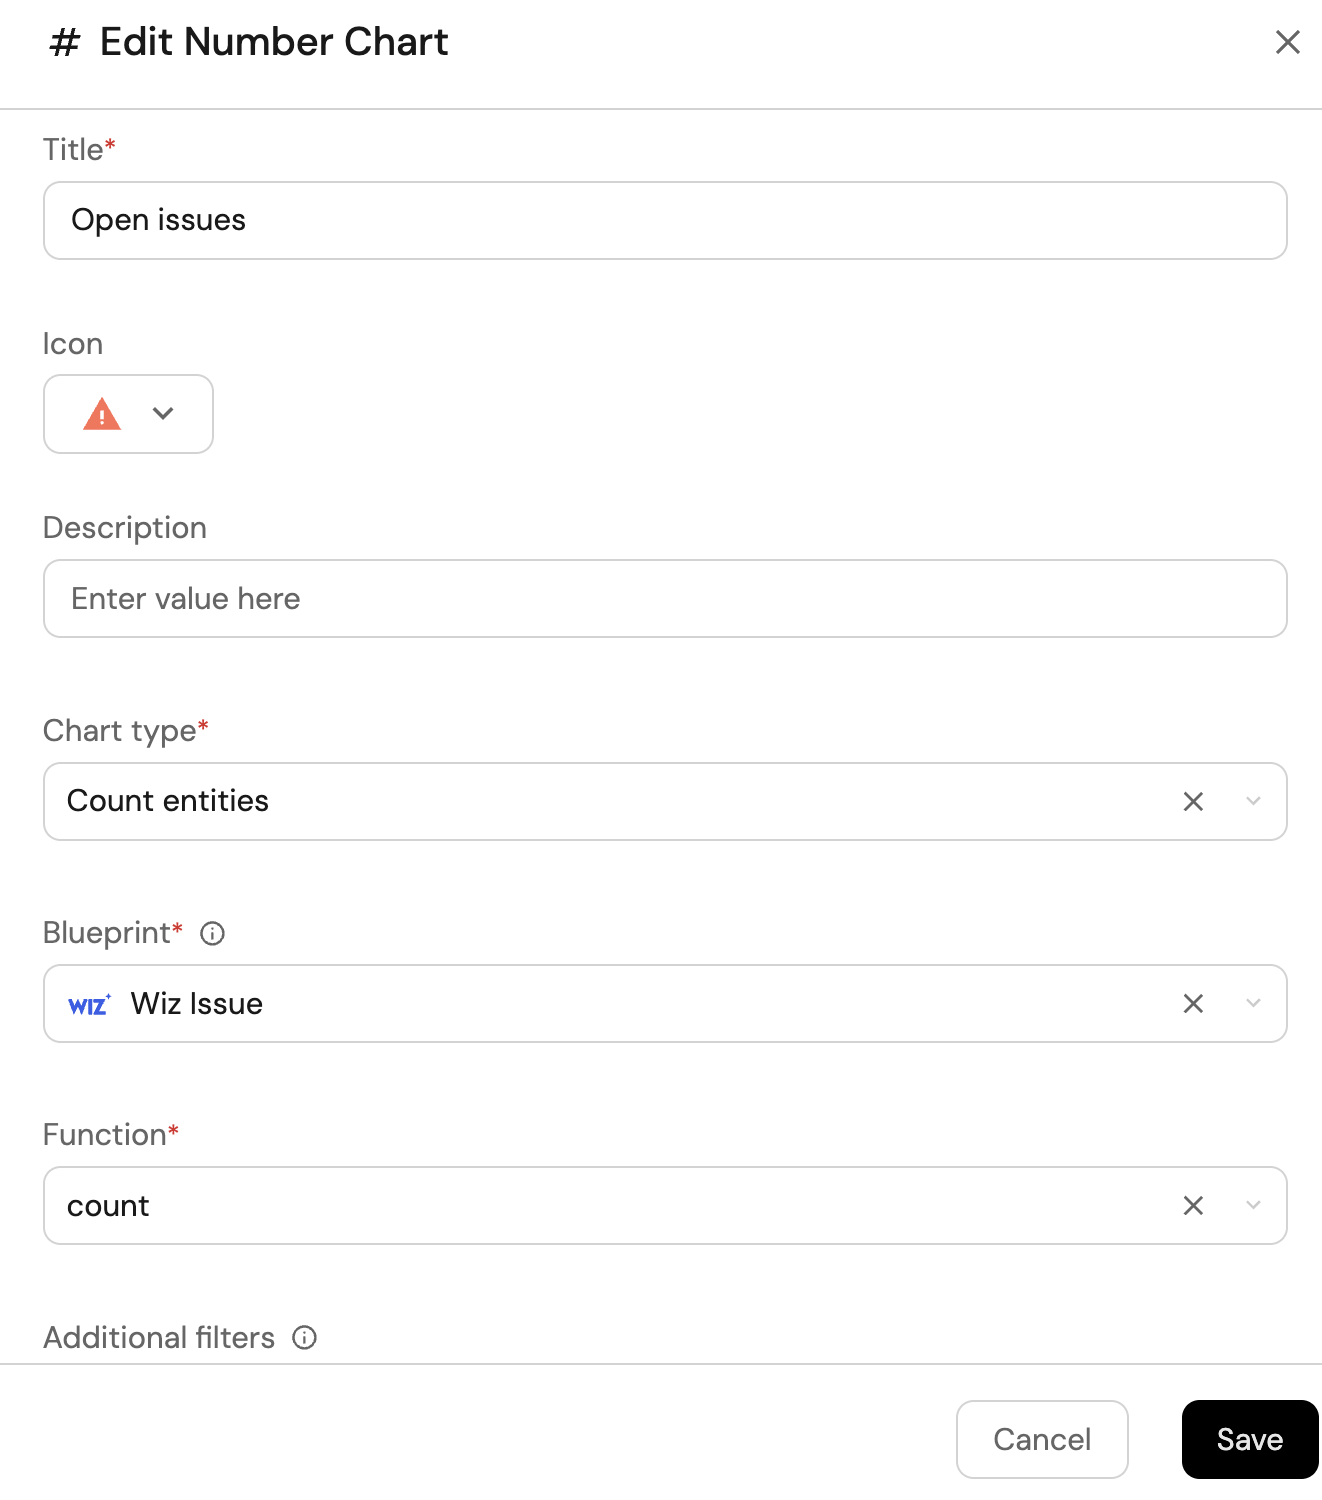
Open issue created in the last 6 months (click to expand)
-
Click
+ Widgetand select Number Chart. -
Title:
Open issues(add theAlerticon). -
Select
Count entitiesChart type and choose Wiz Issue as the Blueprint. -
Select
countfor the Function. -
Add this JSON to the Additional filters editor to filter
OPENissues created in the last 6 months:[
{
"combinator":"and",
"rules":[
{
"property":"status",
"operator":"=",
"value":"OPEN"
},
{
"property":"createdAt",
"operator":"between",
"value":{
"preset":"last6Months"
}
}
]
}
]
-
Click
Save.
Resolved issues (click to expand)
-
Click
+ Widgetand select Number Chart. -
Title:
Resolved issues. -
Select
Count entitiesChart type and choose Wiz Issue as the Blueprint. -
Select
countfor the Function. -
Add this JSON to the Additional filters editor to filter
RESOLVEDissues:[
{
"combinator":"and",
"rules":[
{
"property":"status",
"operator":"=",
"value":"RESOLVED"
}
]
}
]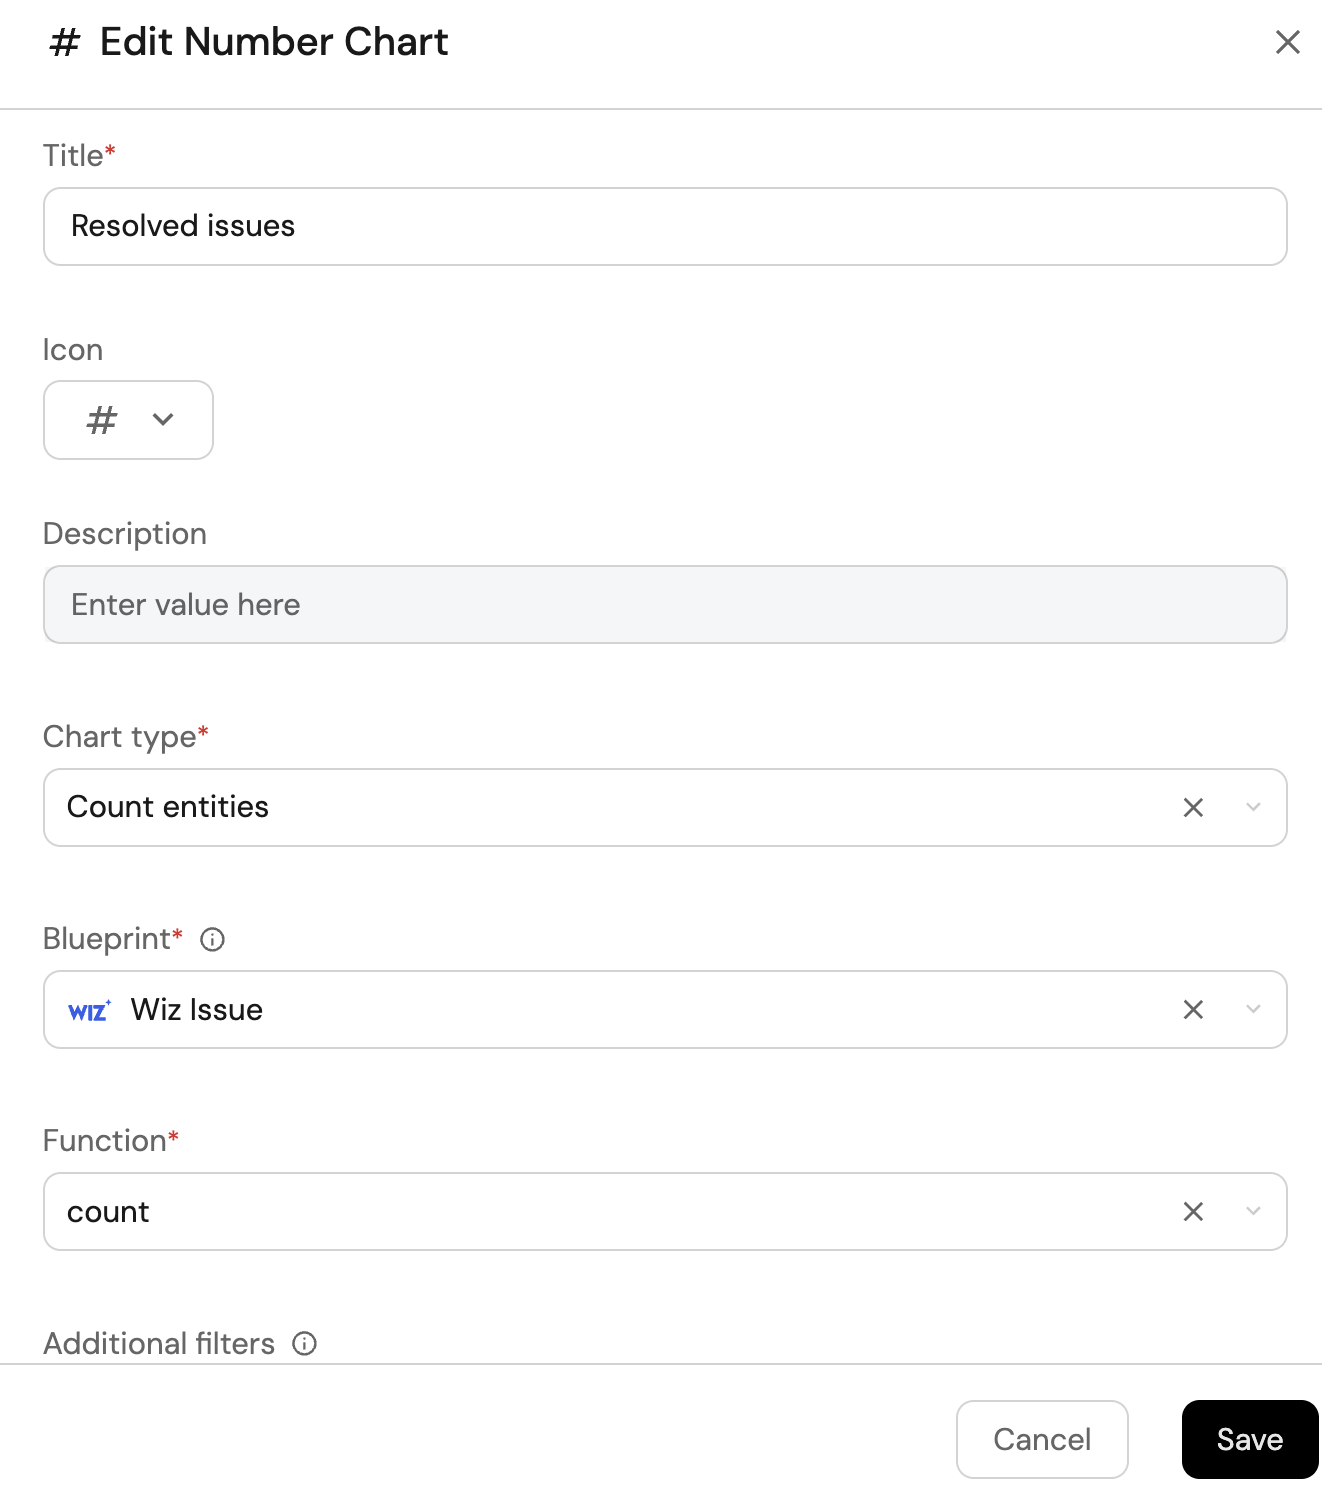
-
Click
Save.
Open critical issues (click to expand)
-
Click
+ Widgetand select Number Chart. -
Title:
Open critical issues. -
Select
Count entitiesChart type and choose Wiz Issue as the Blueprint. -
Select
countfor the Function. -
Add this JSON to the Additional filters editor to filter
OPENandCRITICALissues:[
{
"combinator":"and",
"rules":[
{
"property":"status",
"operator":"=",
"value":"OPEN"
},
{
"property":"severity",
"operator":"=",
"value":"CRITICAL"
}
]
}
]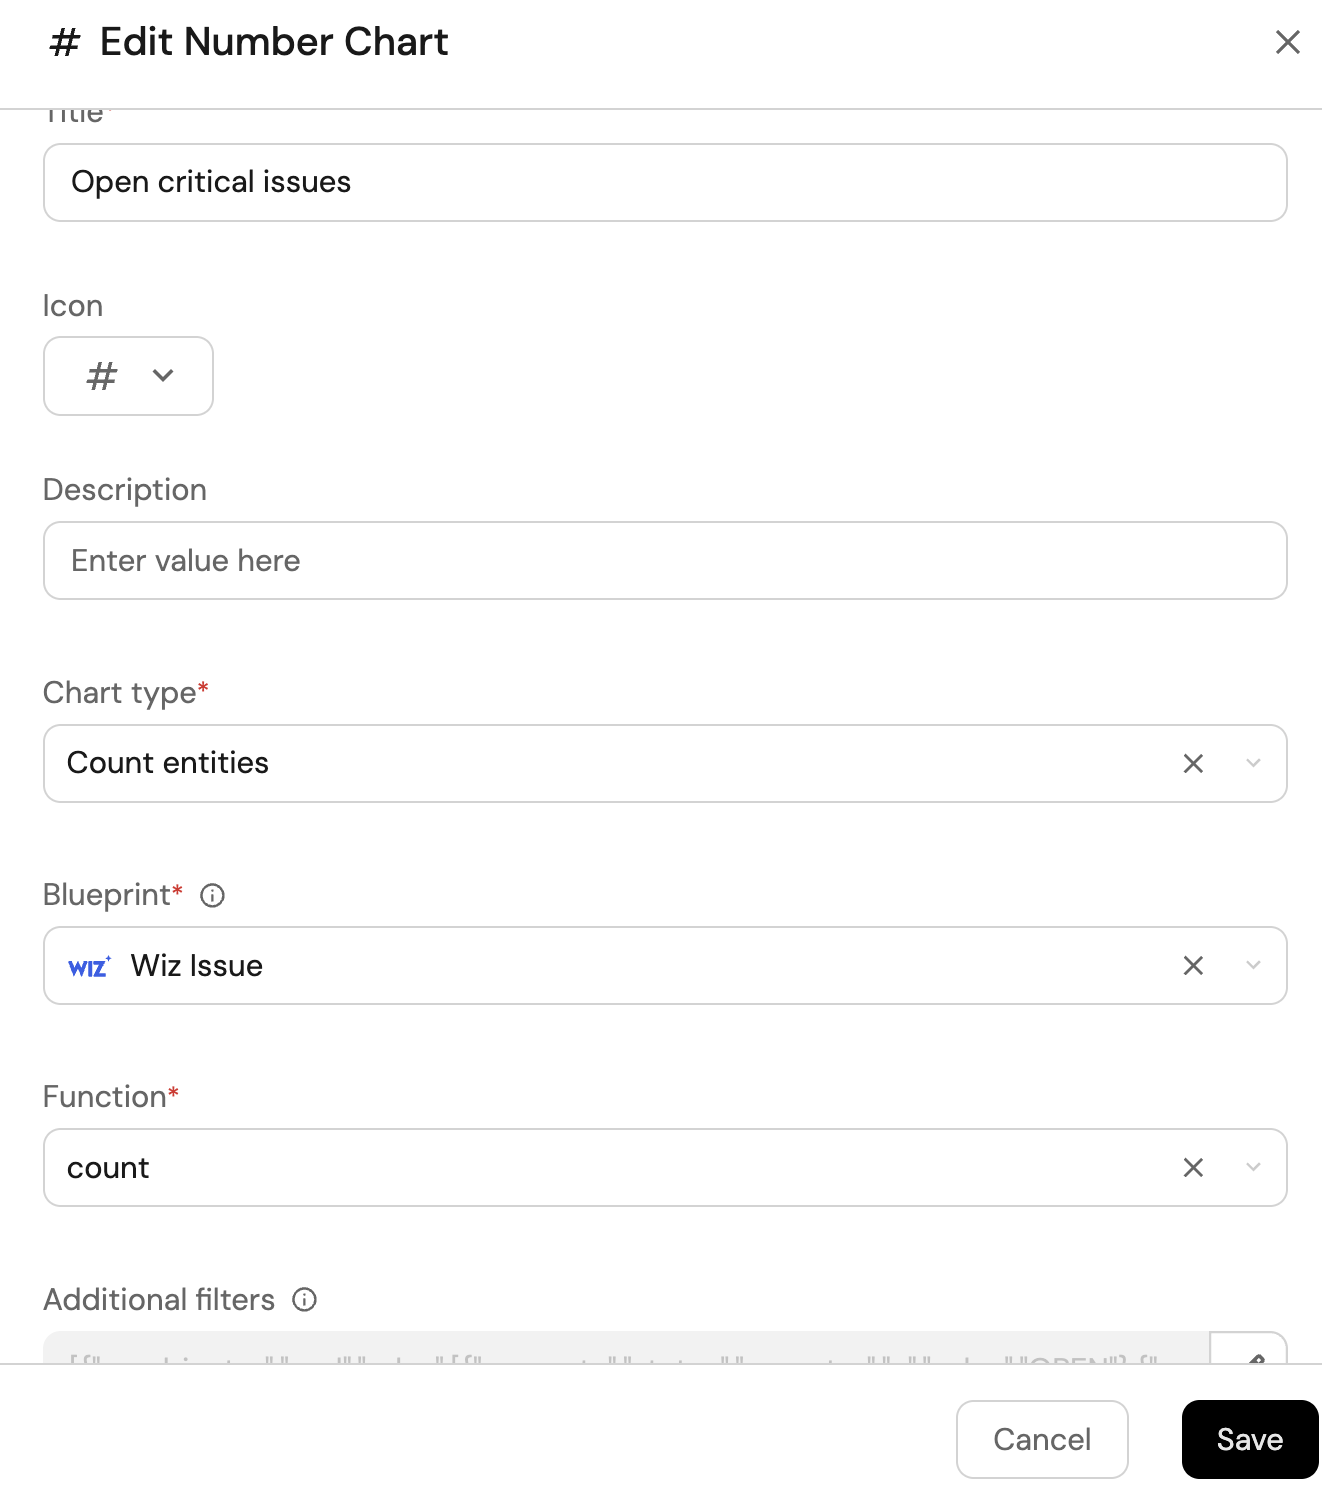
-
Click
Save.